Test Deadlines for Objects [as of BUSINESS Professional]
The dashboard function is subdivided into an overview and a pie chart for each main module:
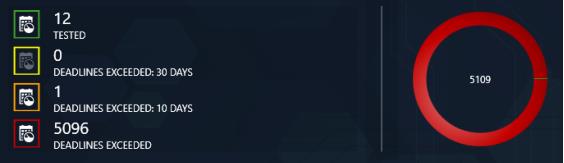
Overview Diagram
The evaluated number of objects belonging to the respective main module are grouped into 4 categories in the overview:
• Icon outlined in green: all objects listed here lie within the individually defined test intervals and have passed the last inspection.
• Icon outlined in yellow: all objects listed here fall within the individually defined escalation time (escalation level 1) and have passed the last inspection.
• Icon outlined in orange: all objects listed here fall within the individually defined escalation time (escalation level 2) and have passed the last inspection.
• Icon outlined in red:all objects listed here are already outside of the individually defined test interval, have not been tested or have not passed the last inspection.
The corresponding objects are displayed in the filter list by selecting the icon outlined in the respective color (see
„Lists“).
Pie Chart
The pie chart shows the percentage distribution of the categories described above, as well as the total number of listed objects.